The Expenses section in Analytics allows you to analyze planned and actual project expenses across all major expense categories in the system. The page helps track budgets, compare planned and actual costs, identify overspending, and quickly process planned expenses.
The section includes the following categories:
- Sublease
- Staff
- Managers
- Vehicles
- Miscellaneous
- Tax
Each category has its own analytics page with detailed breakdowns and aggregation tabs.
Main page
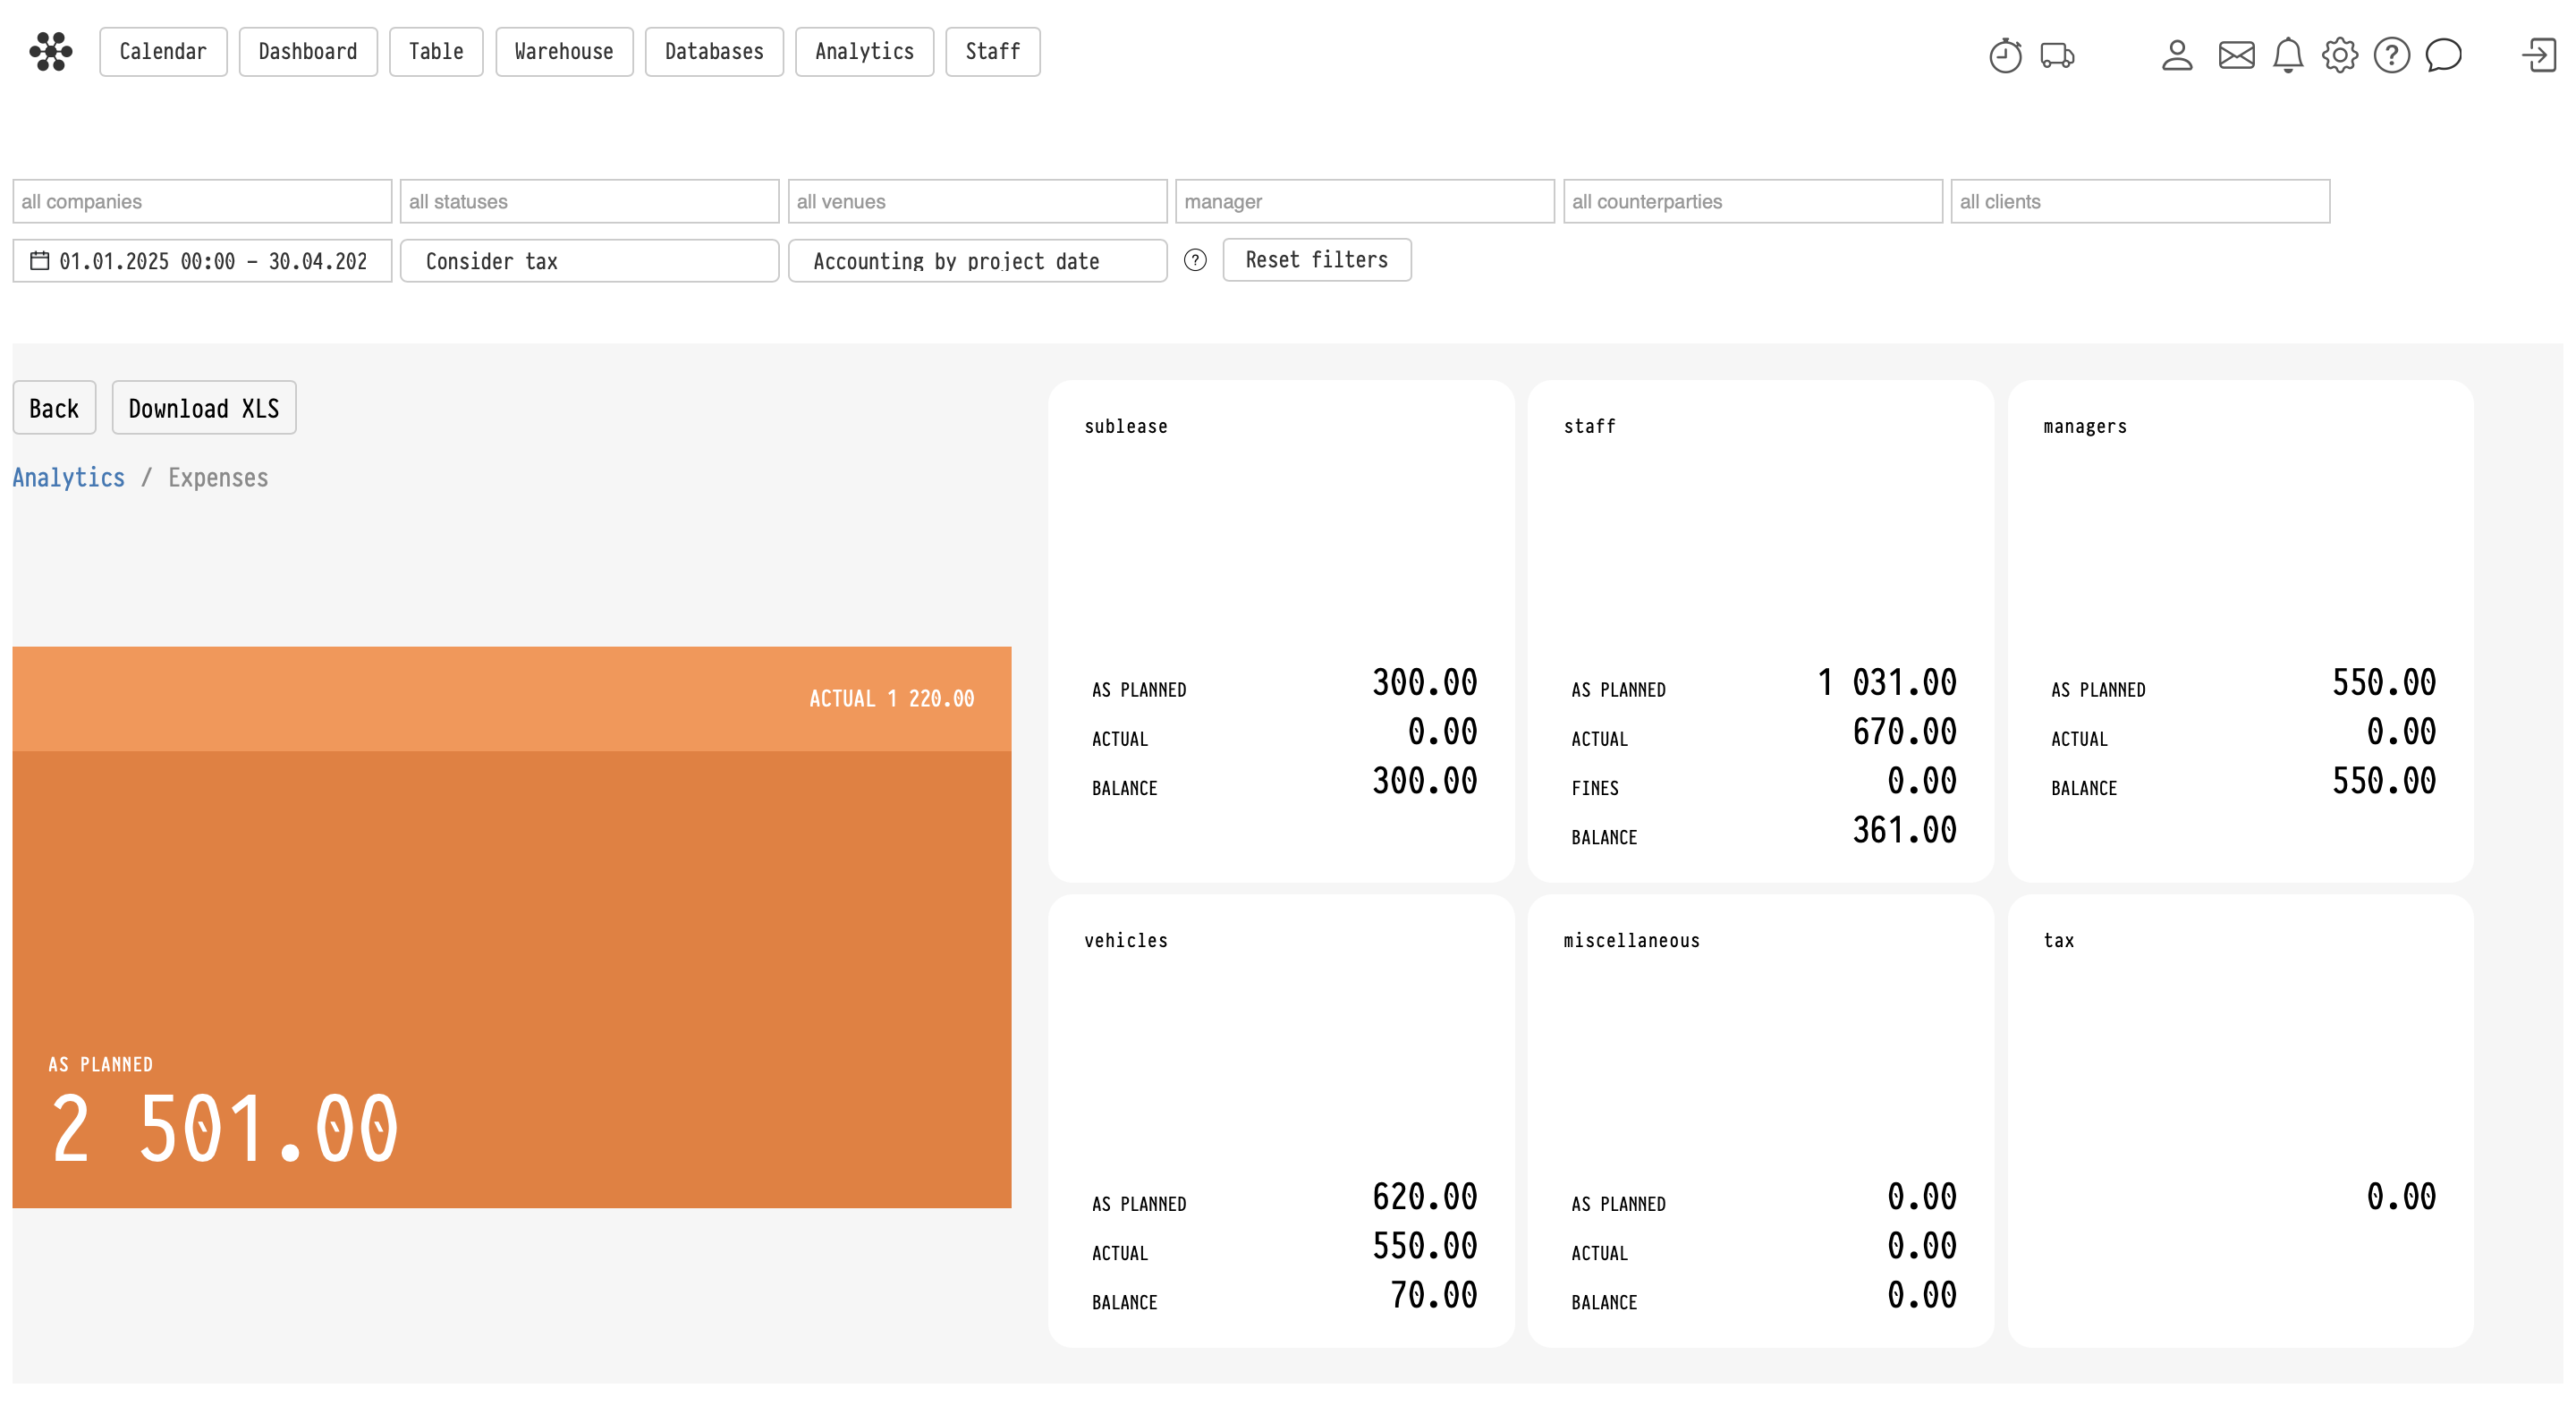
The main Expenses page displays summary cards for all expense categories.
Each card contains:
- As planned — total planned expenses
- Actual — actual processed expenses
- Balance — remaining unprocessed amount
The large chart on the left displays overall totals for all expense categories combined.
Filters
The top part of the page contains common analytics filters:
- companies
- statuses
- venues
- managers
- counterparties
- clients
- date range
You can also use additional settings:
- Consider tax — determines whether taxes are included in expense calculations
- Accounting by project date — determines whether expenses are grouped by the project date or by the expense date itself
This setting is especially important for staff expenses. For example, if a work shift took place before the project date, the expense can either appear in the reporting period of the project itself or in the period when the shift actually occurred.
Processing expenses
Most expense sections support expense processing.
- Process all — processes all planned expenses currently displayed in the table according to the selected filters
- The checkmark icon in a circle processes only a specific row
If the row is aggregated, processing the row applies to all underlying entries included in that group.
Sublease
The Sublease section displays expenses related to rented equipment from external suppliers.
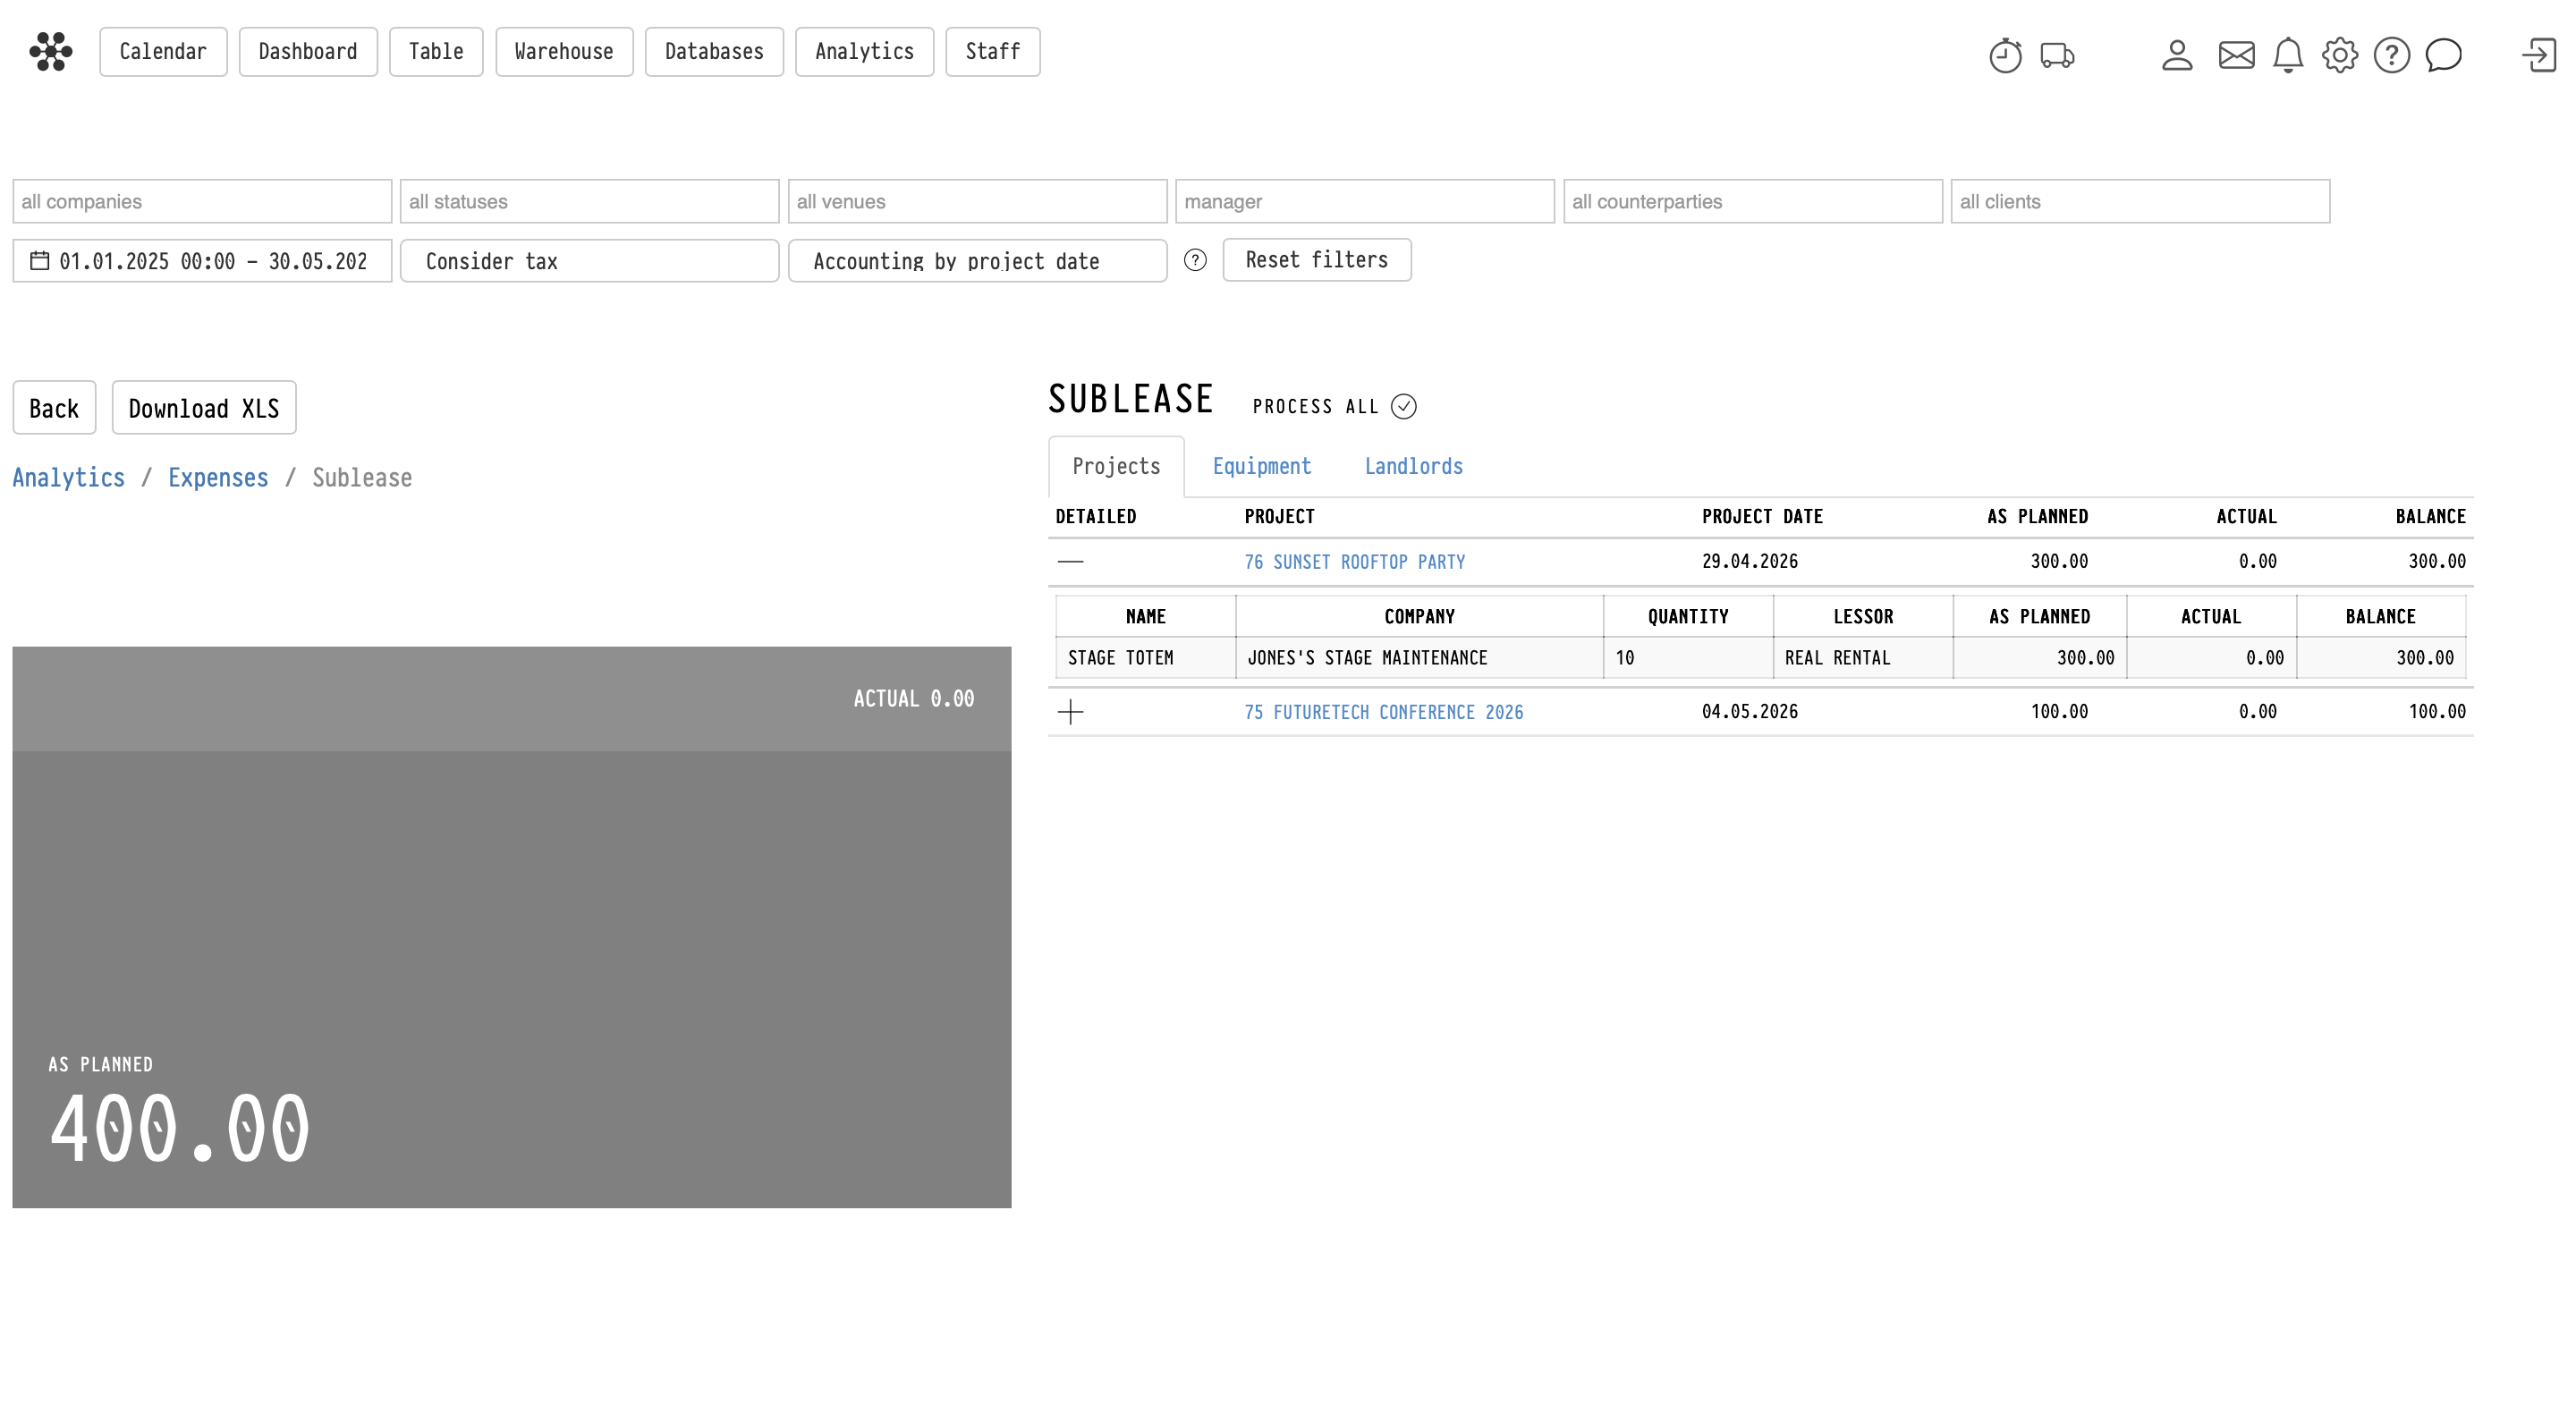
Projects tab
The Projects tab displays all projects containing subleased equipment.
Each row represents a project. Expanding the row using the plus icon displays all subleased positions within that project.
The detailed table contains:
- equipment name
- supplier company
- quantity
- lessor
- planned amount
- actual amount
- balance
Equipment tab
The Equipment tab aggregates data by equipment position.
Rows can be expanded to display all projects where the selected equipment was subleased.
Landlords tab
The Landlords tab aggregates expenses by lessor or supplier.
Rows can be expanded to display all related projects and positions associated with the selected supplier.
Staff
The Staff section displays expenses related to project personnel.
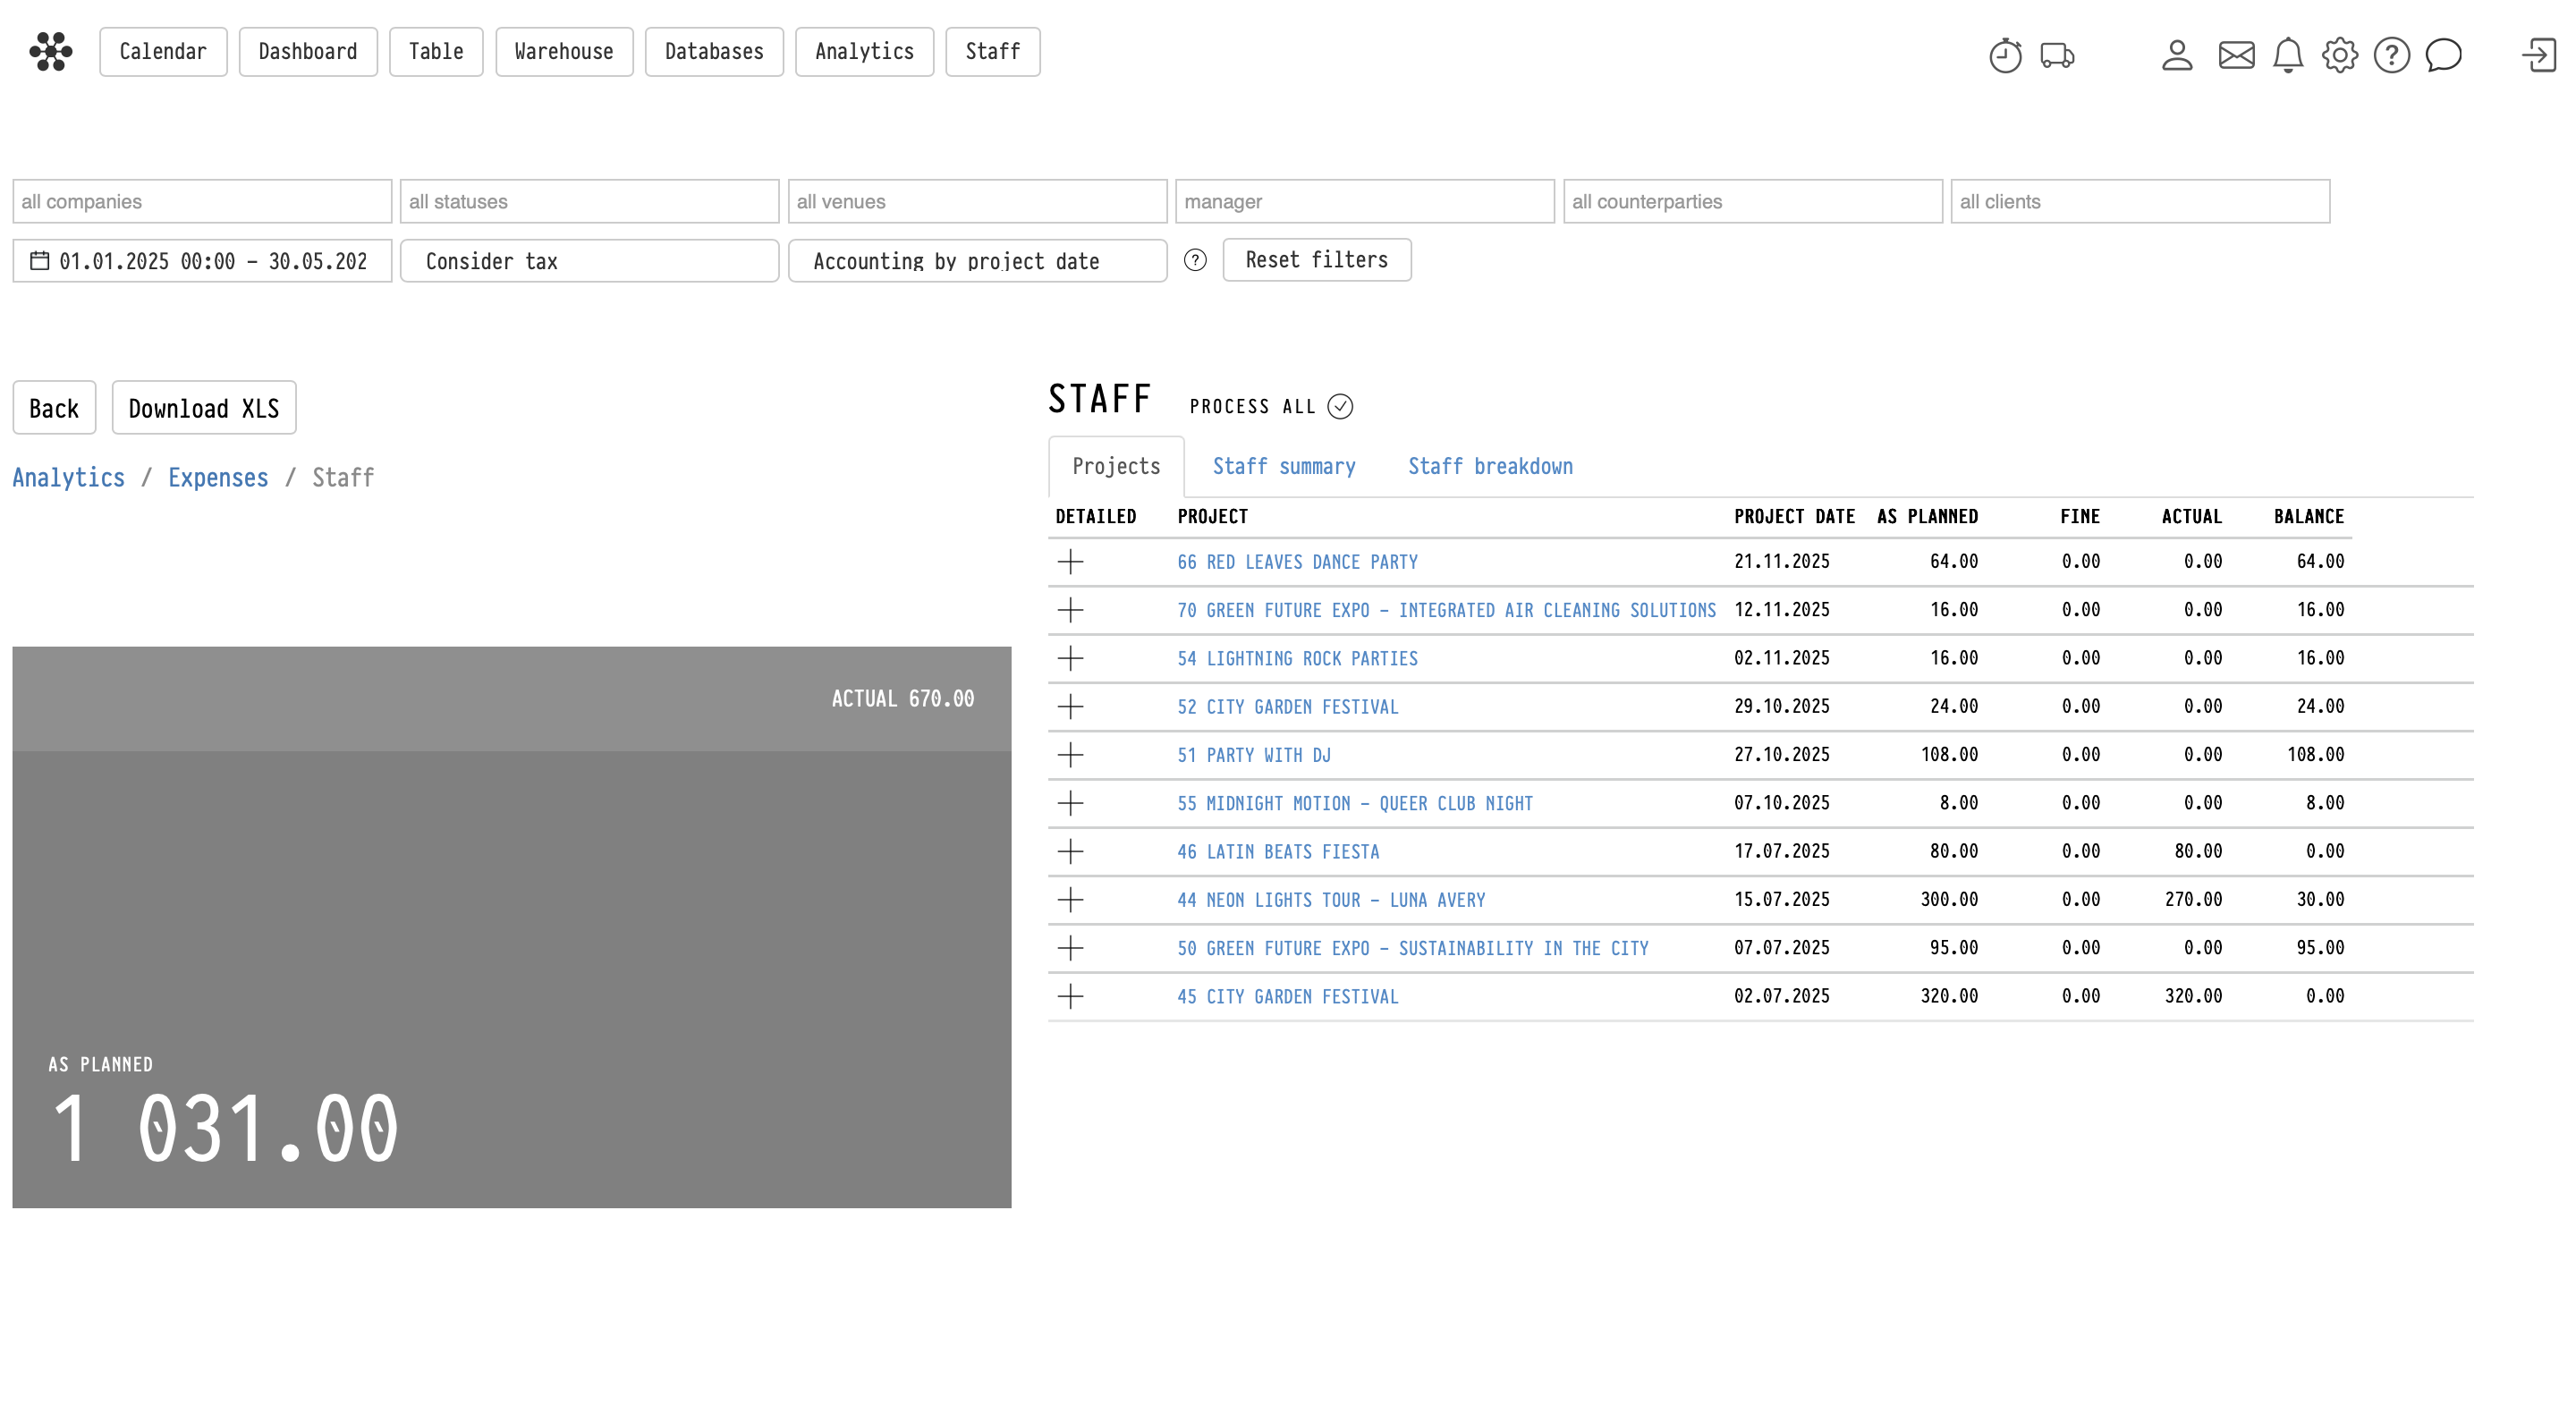
Projects tab
The Projects tab displays all projects containing staff shifts and related staff expenses.
Staff summary
The Staff summary tab aggregates expenses by employee.
Each row represents one employee.
After expanding a row, the system displays all projects where the employee worked. Project rows contain a comma-separated list of all specialties performed by the employee within that project.
Staff breakdown
The Staff breakdown tab provides a detailed shift-level breakdown.
Unlike the summary view, each expanded row represents an individual shift rather than a project.
A single employee may therefore appear multiple times within the same project if they worked multiple shifts.
A shift corresponds to a single row from the Staff block inside the Project planning page.
For example:
- one shift may include multiple specialties (such as technician and loader)
- or the employee may have multiple separate shifts inside the same project
The number of rows in this analytics mode corresponds to the number of shifts rather than the number of specialties.
Fines
The Fine column displays deductions or penalties applied to staff payments.
Managers
The Managers section displays expenses related to project management staff.
Unlike regular staff expenses, managers do not use shifts.
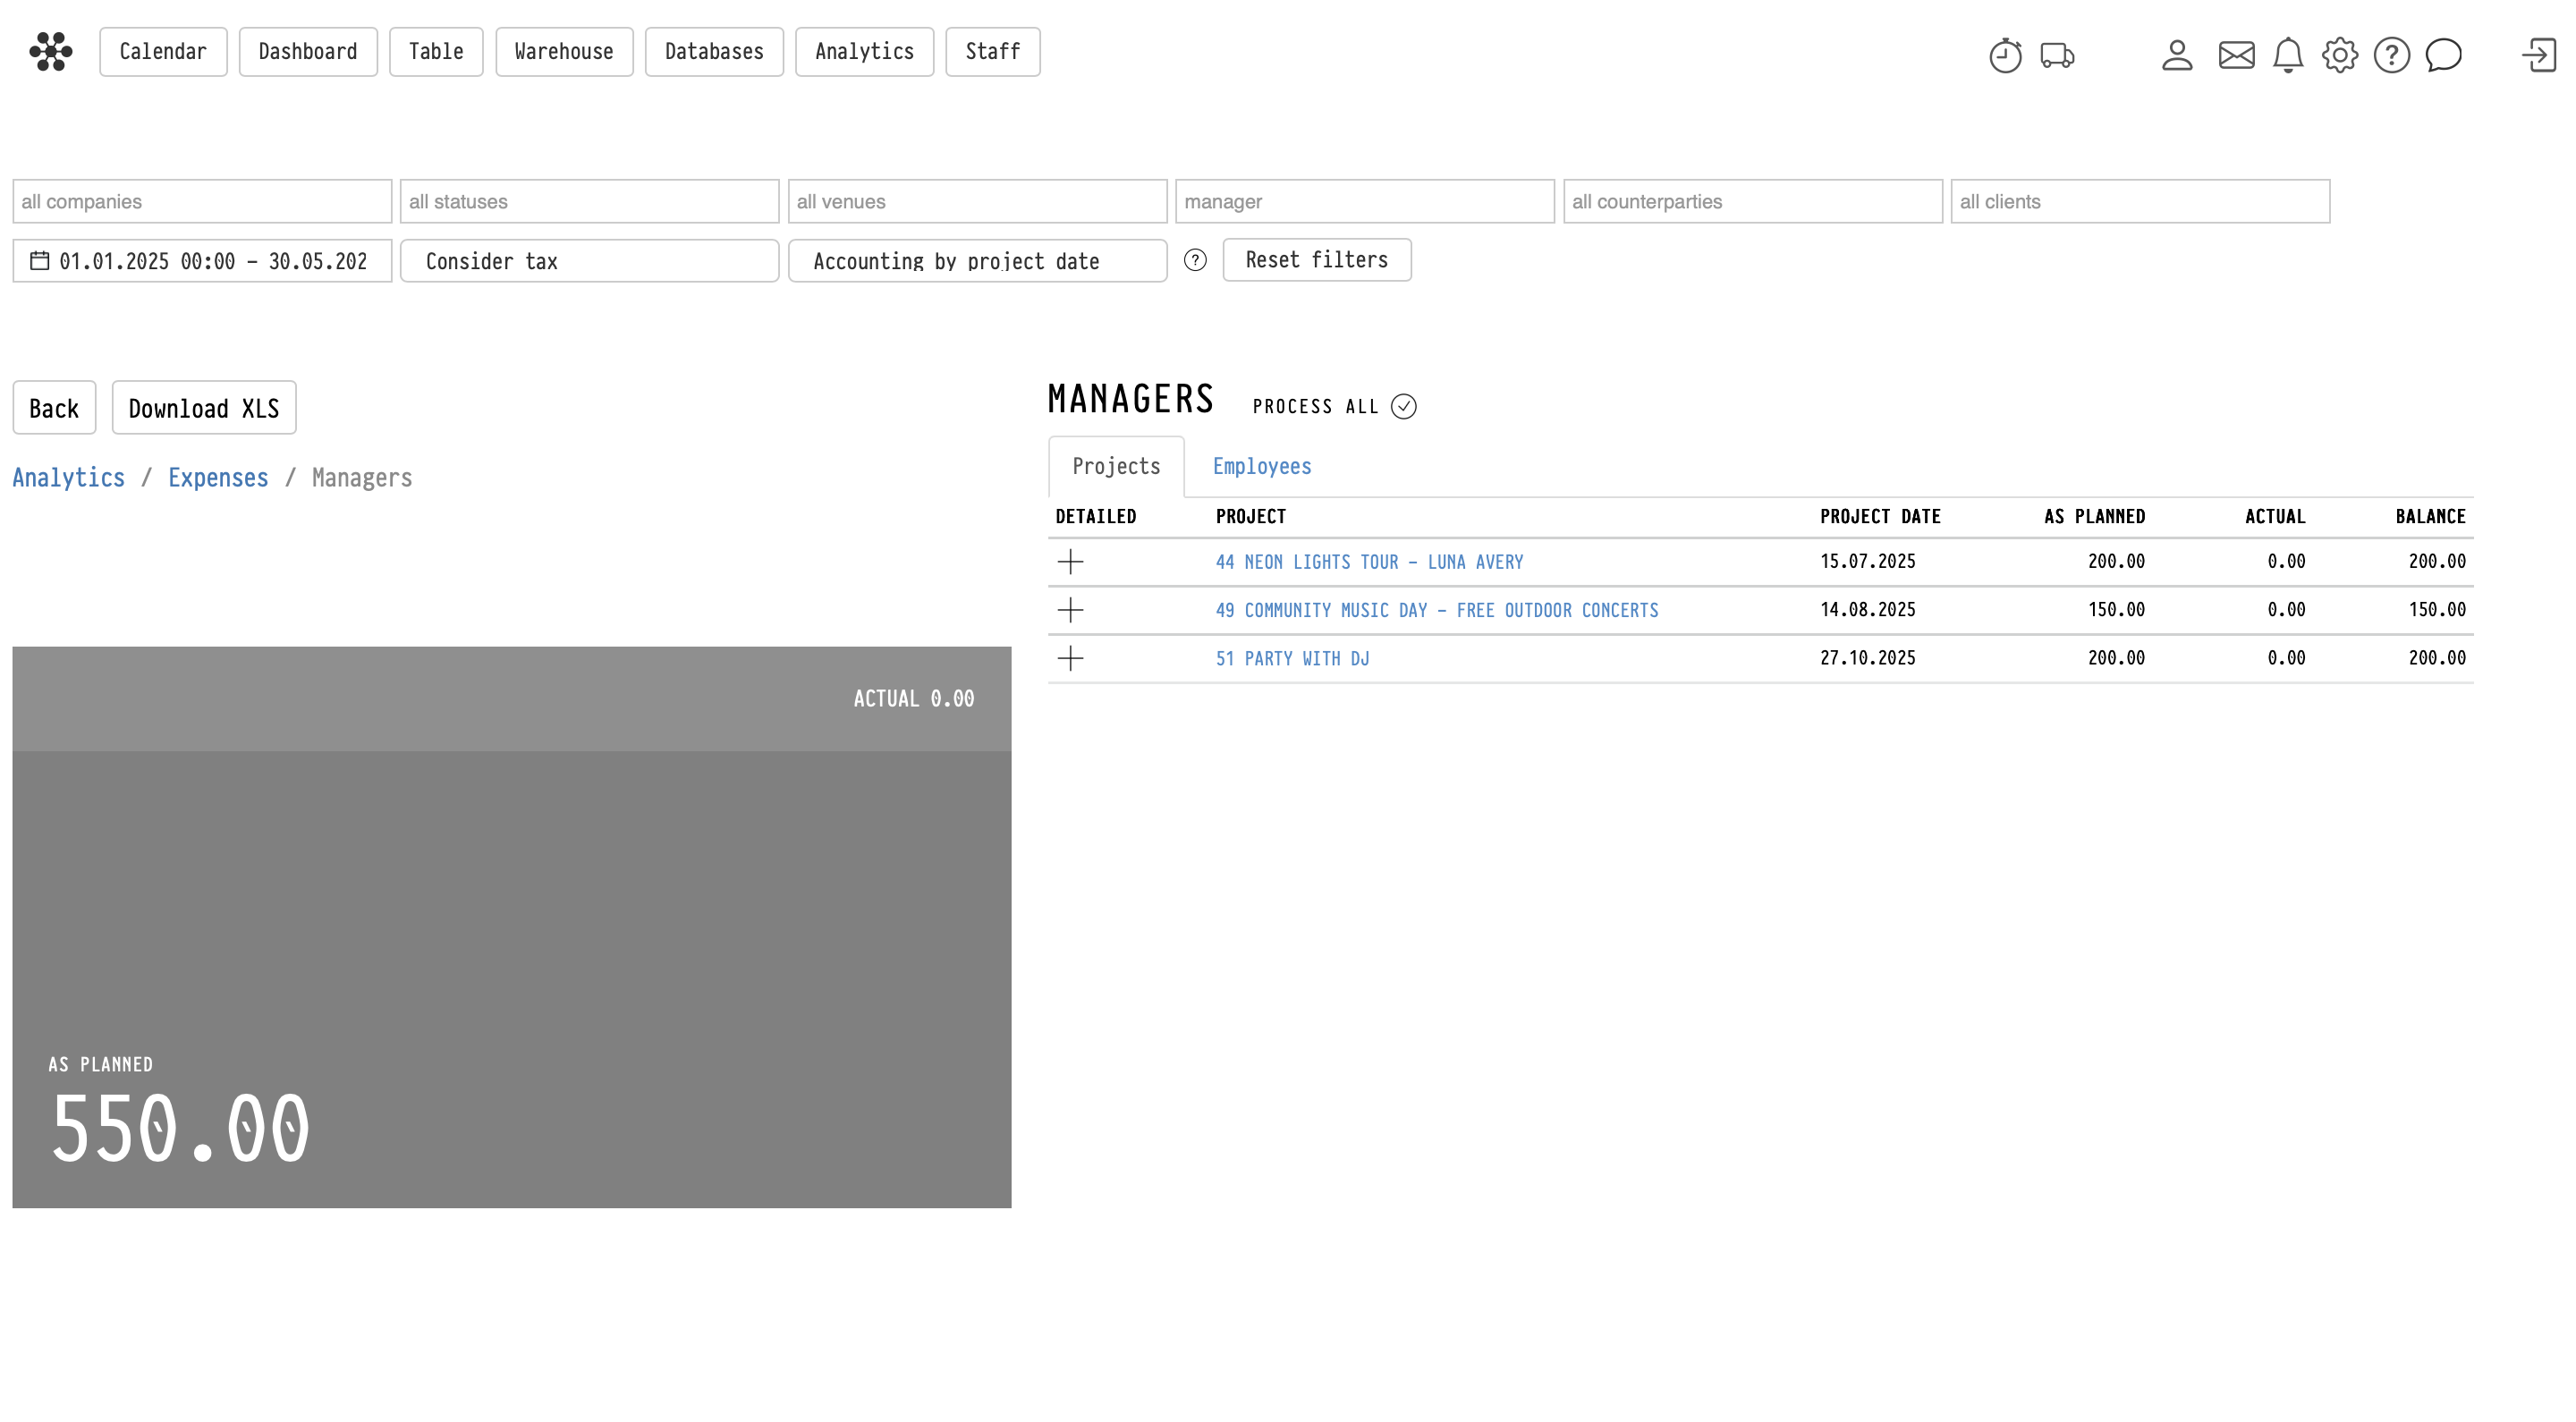
Projects tab
Displays all projects containing manager expenses.
Employees tab
Aggregates expenses by employee.
Rows can be expanded to display all projects associated with the selected manager.
Vehicles
The Vehicles section displays transportation expenses.
Only transport entries from the Transport database are included in this section.
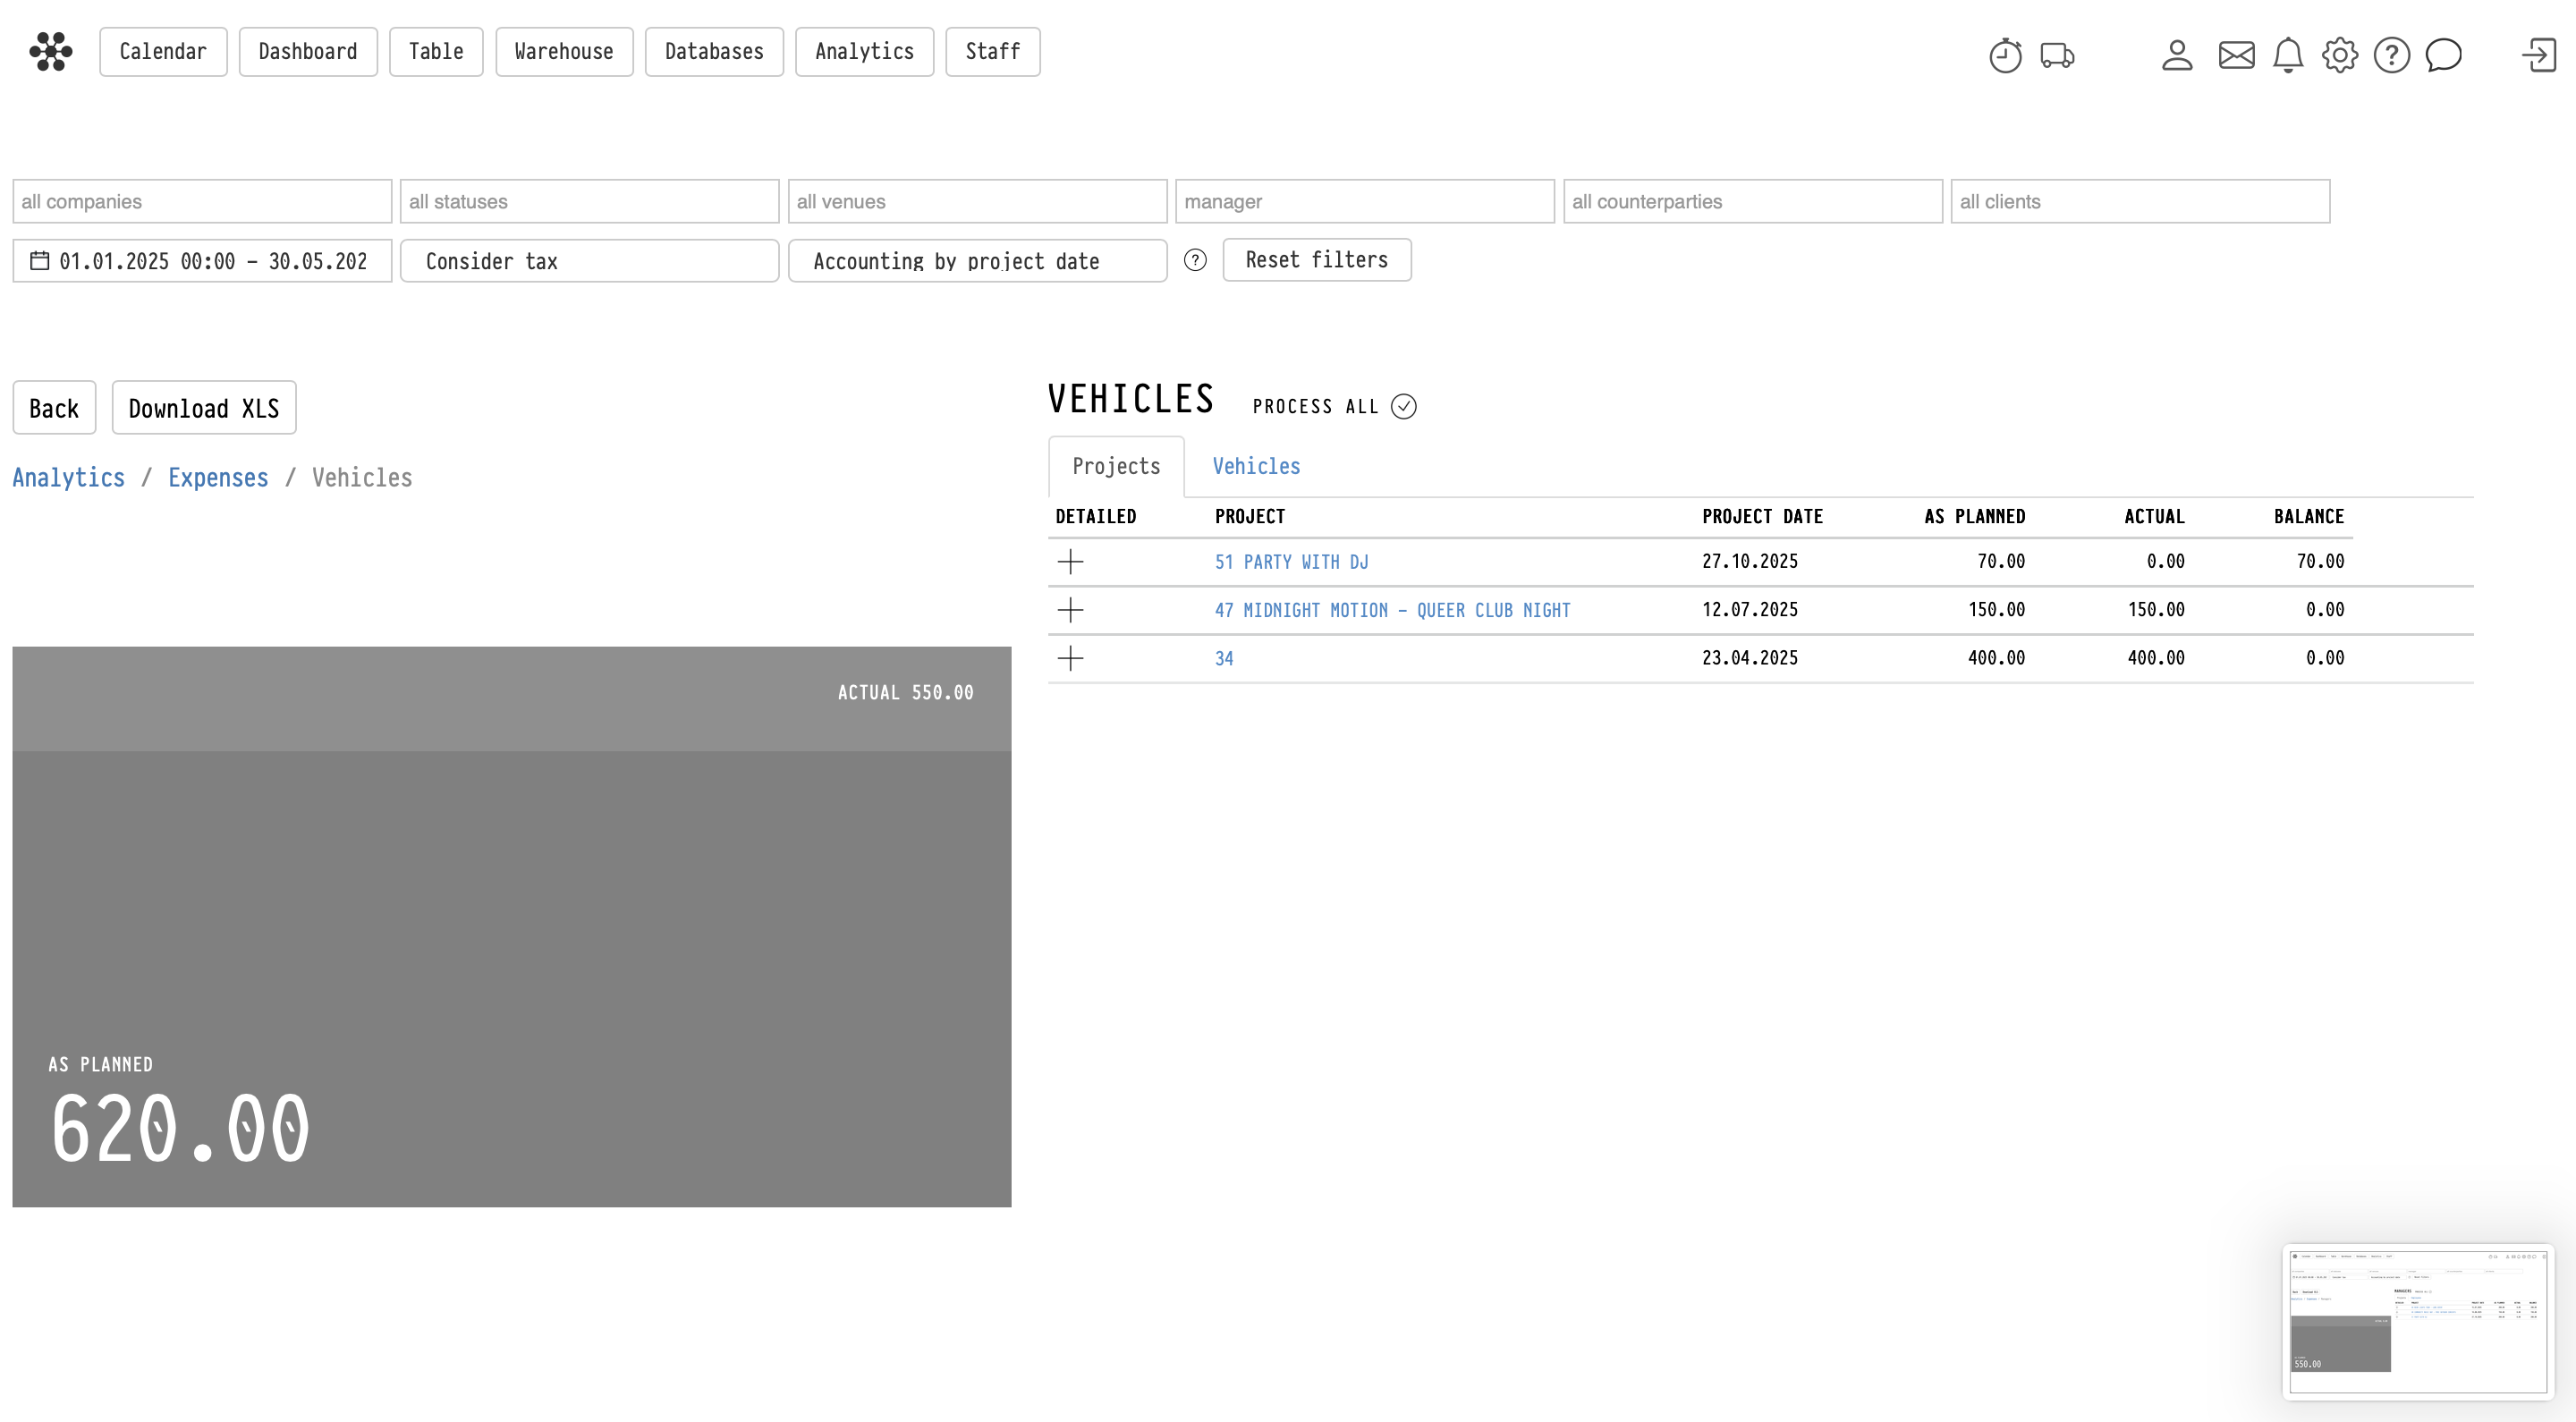
Projects tab
Displays all projects containing transportation expenses.
Vehicles tab
Aggregates expenses by transport unit or vehicle.
Rows can be expanded to display all related projects.
Miscellaneous
The Miscellaneous section displays manually added project expenses.
These expenses are created inside projects on the Finance tab within the Expenses blocks.
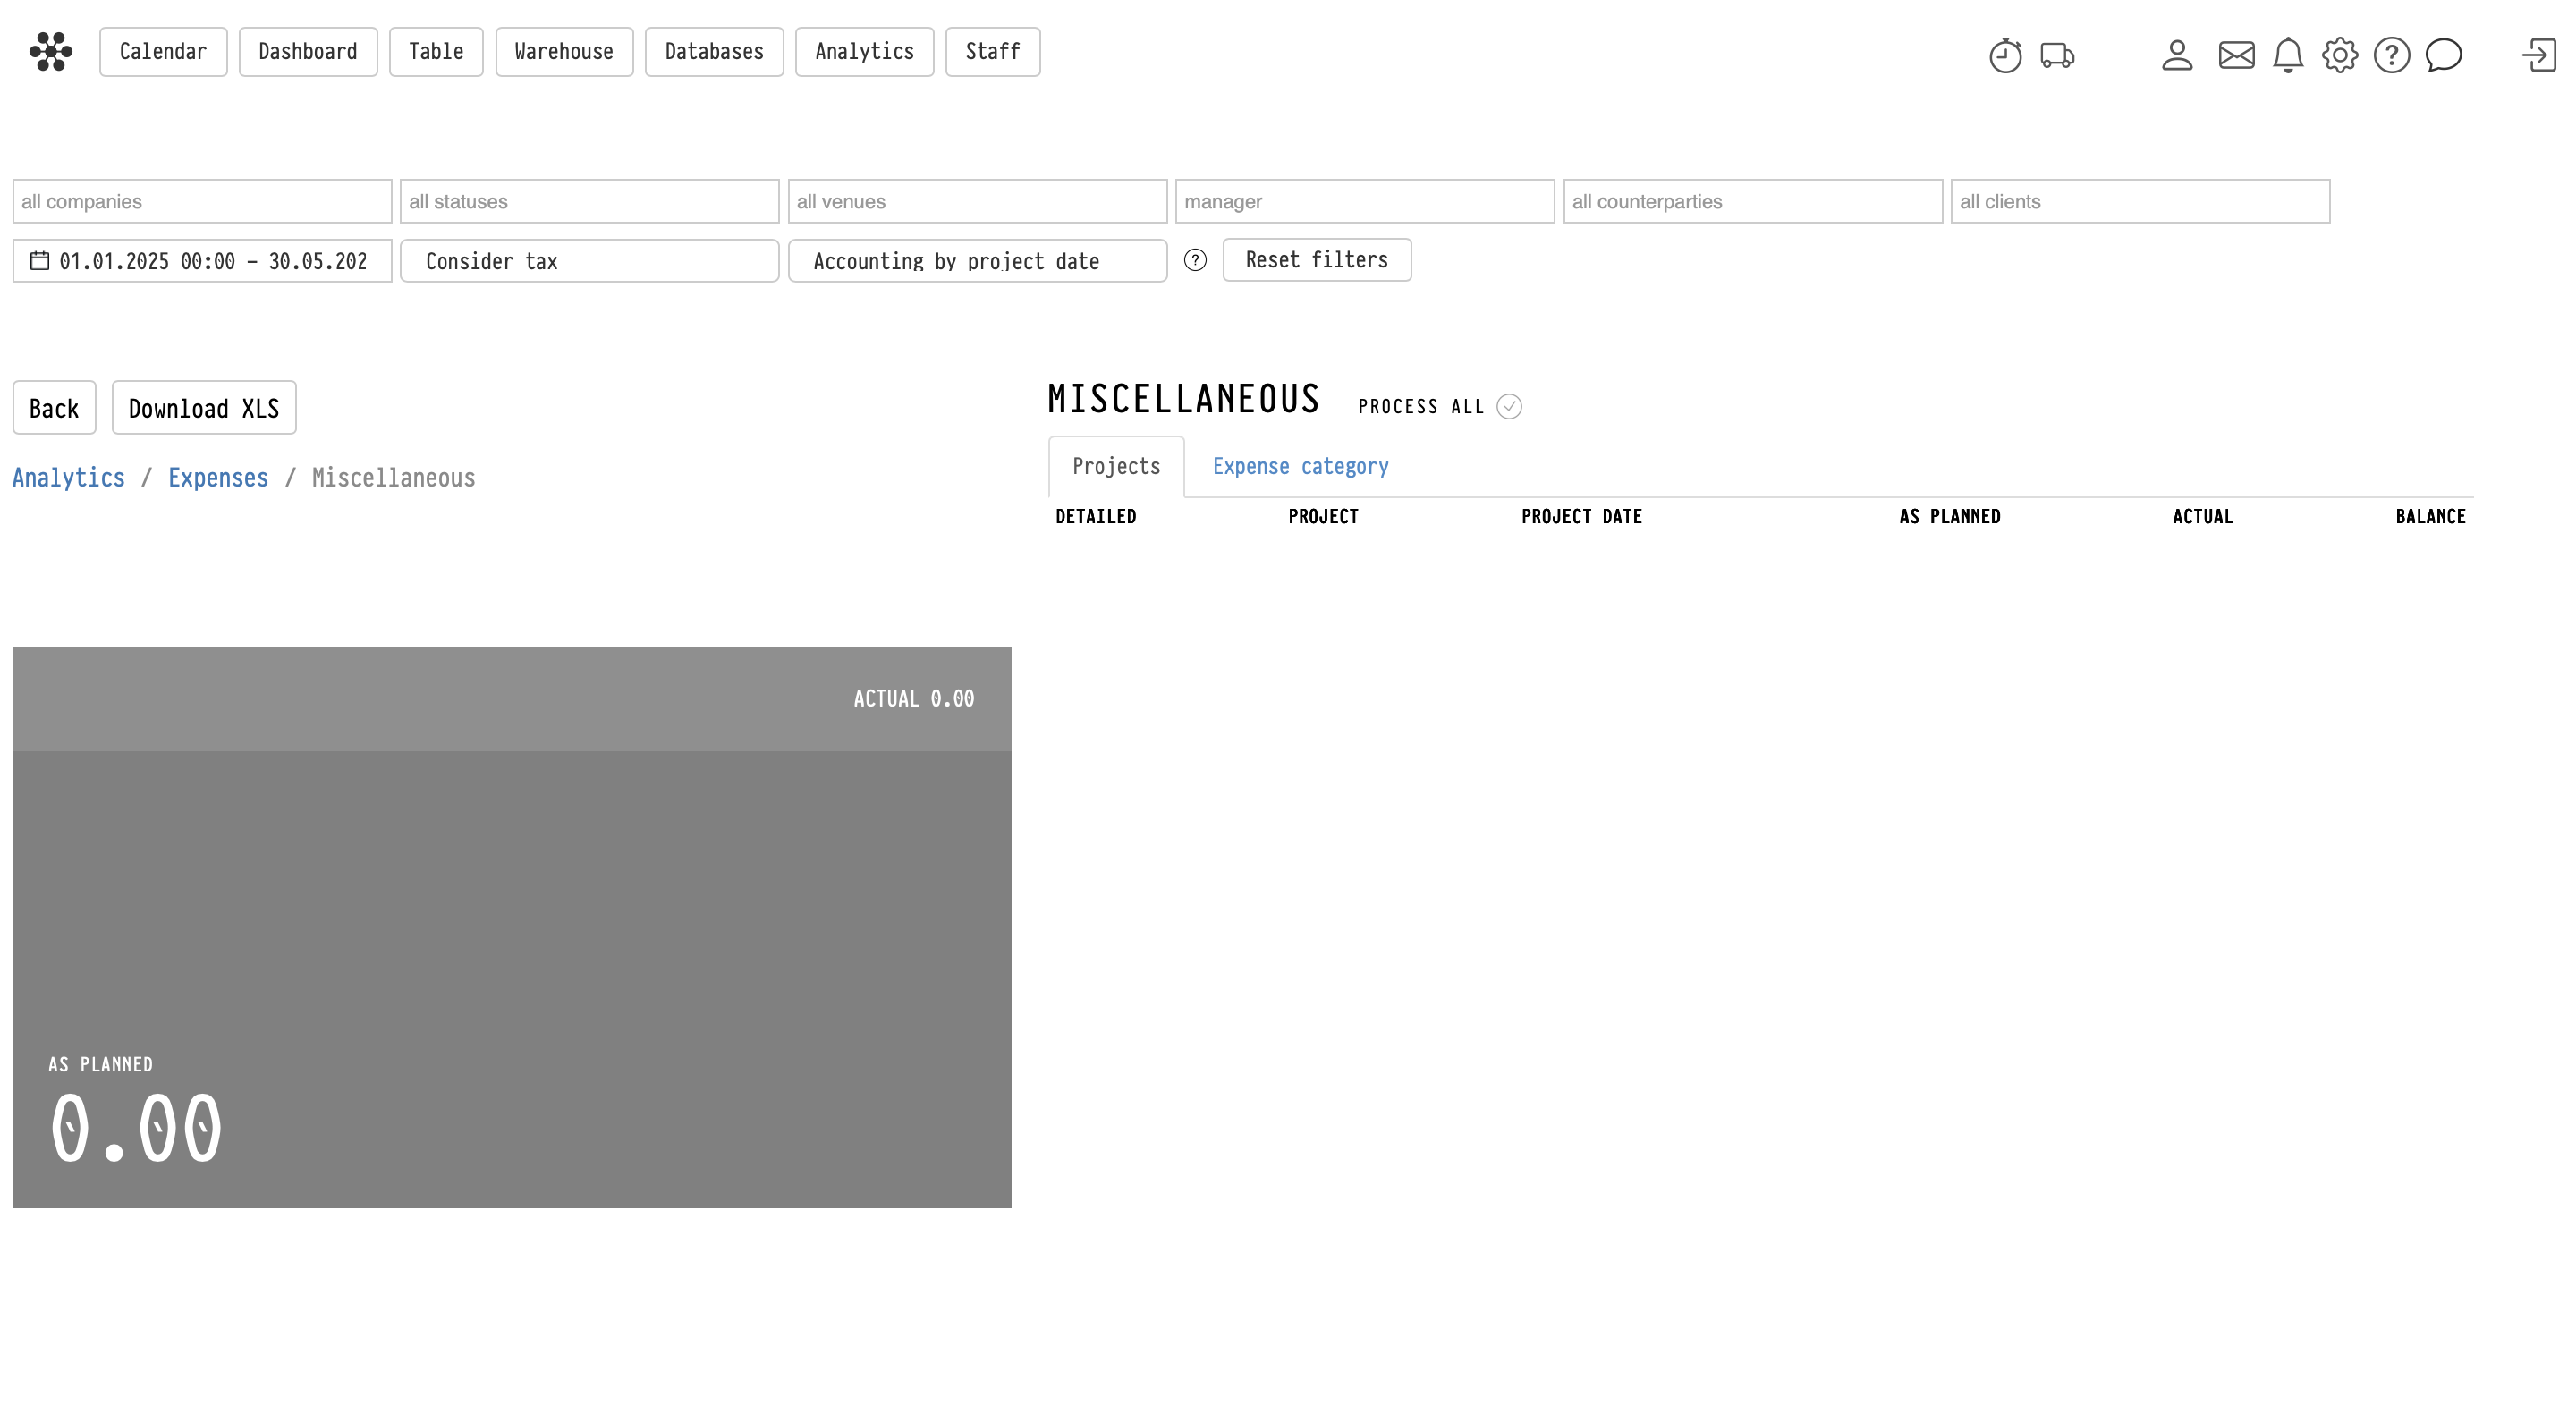
Projects tab
Displays all projects containing miscellaneous expenses.
Expense category tab
Aggregates expenses using the text comment specified for the expense entry.
These categories are free-text values and are grouped automatically by matching text.
Tax
The Tax section displays automatically calculated tax expenses.
Taxes are calculated automatically by the system based on project financial settings.
Projects tab
Displays tax amounts grouped by project.
Companies tab
Aggregates tax expenses by company.
Rows can be expanded to display related projects.
Negative balances
If the actual expense exceeds the planned amount, the balance becomes negative.
This allows you to quickly identify overspending across all expense categories.
Exporting data
The Download XLS button exports the currently displayed analytics table to an Excel file, taking all active filters and settings into account.